Algorithms Archives - Critical Care Science (CCS)

Abstract
Rev Bras Ter Intensiva. 2022;34(4):477-483
DOI 10.5935/0103-507X.20220280-en
To create and validate a model for predicting septic or hypovolemic shock from easily obtainable variables collected from patients at admission to an intensive care unit.
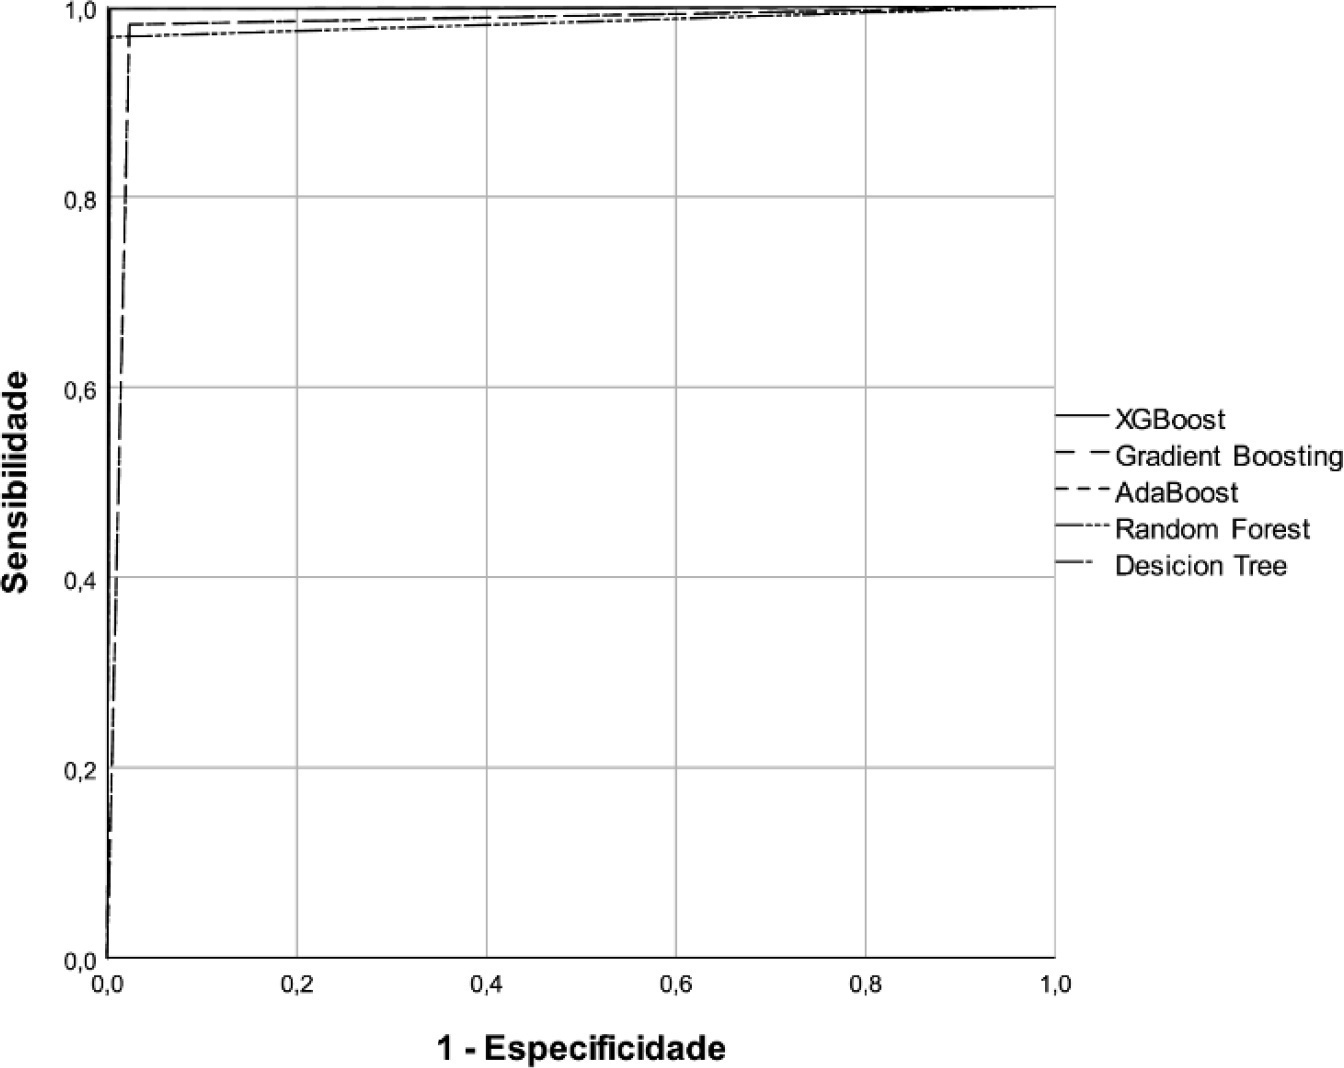
A predictive modeling study with concurrent cohort data was conducted in a hospital in the interior of northeastern Brazil. Patients aged 18 years or older who were not using vasoactive drugs on the day of admission and were hospitalized from November 2020 to July 2021 were included. The Decision Tree, Random Forest, AdaBoost, Gradient Boosting and XGBoost classification algorithms were tested for use in building the model. The validation method used was k-fold cross validation. The evaluation metrics used were recall, precision and area under the Receiver Operating Characteristic curve.
A total of 720 patients were used to create and validate the model. The models showed high predictive capacity with areas under the Receiver Operating Characteristic curve of 0.979; 0.999; 0.980; 0.998 and 1.00 for the Decision Tree, Random Forest, AdaBoost, Gradient Boosting and XGBoost algorithms, respectively.
The predictive model created and validated showed a high ability to predict septic and hypovolemic shock from the time of admission of patients to the intensive care unit.
Abstract
Rev Bras Ter Intensiva. 2022;34(4):477-483
DOI 10.5935/0103-507X.20220280-en
To create and validate a model for predicting septic or hypovolemic shock from easily obtainable variables collected from patients at admission to an intensive care unit.
A predictive modeling study with concurrent cohort data was conducted in a hospital in the interior of northeastern Brazil. Patients aged 18 years or older who were not using vasoactive drugs on the day of admission and were hospitalized from November 2020 to July 2021 were included. The Decision Tree, Random Forest, AdaBoost, Gradient Boosting and XGBoost classification algorithms were tested for use in building the model. The validation method used was k-fold cross validation. The evaluation metrics used were recall, precision and area under the Receiver Operating Characteristic curve.
A total of 720 patients were used to create and validate the model. The models showed high predictive capacity with areas under the Receiver Operating Characteristic curve of 0.979; 0.999; 0.980; 0.998 and 1.00 for the Decision Tree, Random Forest, AdaBoost, Gradient Boosting and XGBoost algorithms, respectively.
The predictive model created and validated showed a high ability to predict septic and hypovolemic shock from the time of admission of patients to the intensive care unit.
Abstract
Rev Bras Ter Intensiva. 2021;33(2):196-205
DOI 10.5935/0103-507X.20210027
To identify more severe COVID-19 presentations.
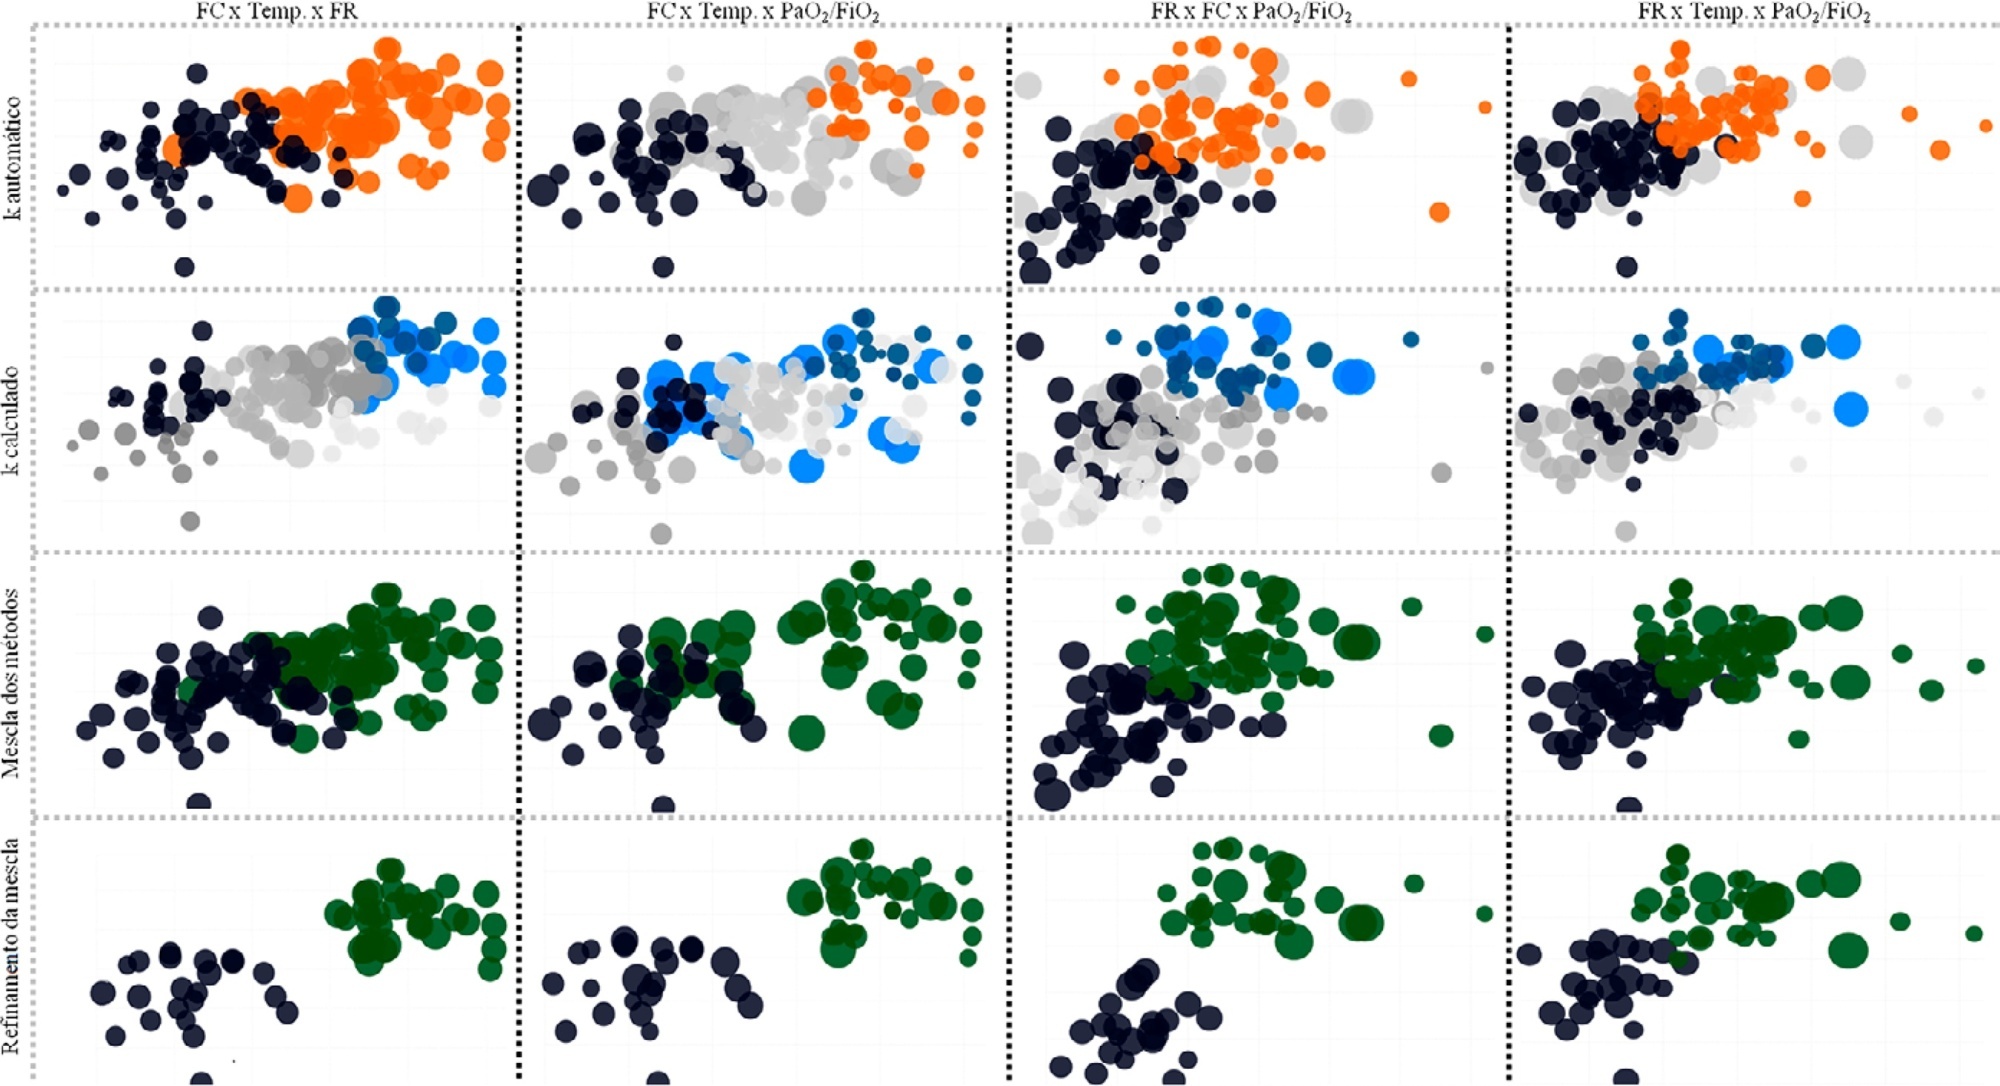
Consecutive intensive care unit-admitted patients were subjected to a stepwise clustering method.
Data from 147 patients who were on average 56 ± 16 years old with a Simplified Acute Physiological Score 3 of 72 ± 18, of which 103 (70%) needed mechanical ventilation and 46 (31%) died in the intensive care unit, were analyzed. From the clustering algorithm, two well-defined groups were found based on maximal heart rate [Cluster A: 104 (95%CI 99 - 109) beats per minute versus Cluster B: 159 (95%CI 155 - 163) beats per minute], maximal respiratory rate [Cluster A: 33 (95%CI 31 - 35) breaths per minute versus Cluster B: 50 (95%CI 47 - 53) breaths per minute], and maximal body temperature [Cluster A: 37.4 (95%CI 37.1 - 37.7)°C versus Cluster B: 39.3 (95%CI 39.1 - 39.5)°C] during the intensive care unit stay, as well as the oxygen partial pressure in the blood over the oxygen inspiratory fraction at intensive care unit admission [Cluster A: 116 (95%CI 99 - 133) mmHg versus Cluster B: 78 (95%CI 63 - 93) mmHg]. Subphenotypes were distinct in inflammation profiles, organ dysfunction, organ support, intensive care unit length of stay, and intensive care unit mortality (with a ratio of 4.2 between the groups).
Our findings, based on common clinical data, revealed two distinct subphenotypes with different disease courses. These results could help health professionals allocate resources and select patients for testing novel therapies.
Abstract
Rev Bras Ter Intensiva. 2021;33(2):196-205
DOI 10.5935/0103-507X.20210027
To identify more severe COVID-19 presentations.
Consecutive intensive care unit-admitted patients were subjected to a stepwise clustering method.
Data from 147 patients who were on average 56 ± 16 years old with a Simplified Acute Physiological Score 3 of 72 ± 18, of which 103 (70%) needed mechanical ventilation and 46 (31%) died in the intensive care unit, were analyzed. From the clustering algorithm, two well-defined groups were found based on maximal heart rate [Cluster A: 104 (95%CI 99 - 109) beats per minute versus Cluster B: 159 (95%CI 155 - 163) beats per minute], maximal respiratory rate [Cluster A: 33 (95%CI 31 - 35) breaths per minute versus Cluster B: 50 (95%CI 47 - 53) breaths per minute], and maximal body temperature [Cluster A: 37.4 (95%CI 37.1 - 37.7)°C versus Cluster B: 39.3 (95%CI 39.1 - 39.5)°C] during the intensive care unit stay, as well as the oxygen partial pressure in the blood over the oxygen inspiratory fraction at intensive care unit admission [Cluster A: 116 (95%CI 99 - 133) mmHg versus Cluster B: 78 (95%CI 63 - 93) mmHg]. Subphenotypes were distinct in inflammation profiles, organ dysfunction, organ support, intensive care unit length of stay, and intensive care unit mortality (with a ratio of 4.2 between the groups).
Our findings, based on common clinical data, revealed two distinct subphenotypes with different disease courses. These results could help health professionals allocate resources and select patients for testing novel therapies.